Topics: Linux, Home Automation, Docker
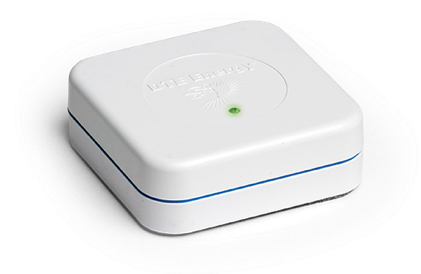
Remember the good old days when neighbors knew each other, cars had chrome bumpers, and nobody had any idea how much electricity they were using until a bill came in the mail? Well, a few years back, my local power company started offering a mobile app that customers could use to track their energy usage. This was made possible by the introduction of smart meters which transmit (by radio) each customer's electricity usage to the power company at a rate of once per hour or so. With this app, it is possible to see your actual real-time usage if you also install this little device they call an "energy bridge" in your home1.
In a nutshell, the energy bridge is just a little square box with a power connector and Ethernet jack. It contains a Zigbee radio that speaks softly to the smart meter to get the current energy usage. The bridge device then carefully packages the usage information and sends it up to The Cloud where the mobile app on your phone can lovingly harvest the data and knead it into beautiful graphs and all of that crap.
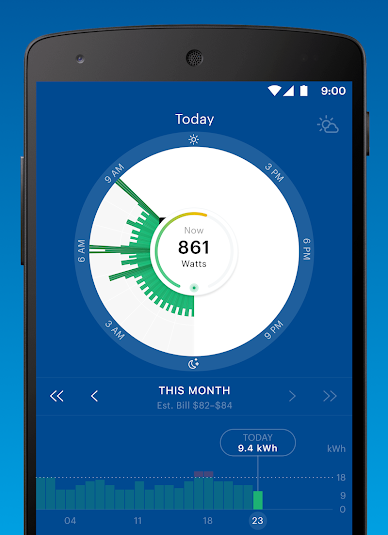
While using the device, I gained a lot of insight (zing!) as to where my energy usage was. For example, I now know that my house's electricity usage is at least 4 kW when the air conditioner is running. The next biggest energy-hungry device is the dishwasher which uses a little over 2 kW when it's running2. The house's idle power draw tends to be between 300 and 500 watts so clearly I have some sleuthing to do.
So, in that regard, it's been a dandy little device and I'd like to continue using it. Unfortunately the power company has deprecated this energy bridge. The mobile app no longer displays real-time usage and there's an info page telling me I that they now offer an upgraded model, which is also "free", but you have to pay $1 per month to use it. I'm sure that's a great deal for a lot of people. But as you may already know, I'm an unapologetic cheapskate. So let's get started on a solution that's half as useful and ten times the effort, shall we?
Through friends at work, I learned that even though the old bridge won't work with the power company's new cloud stuff, it can still be accessed locally over the network. Port 80 (HTTP) is open but the root URL only returns a 404. I don't know how they were discovered but people have found endpoints that return various things:
/statusreturns a good amount of JSON-formatted info about the device./instantaneousdemandreturns the current energy usage as a string./history/since/<epoch seconds>binary output of some kind./history/since/{epoch_seconds}/until/{epoch_seconds}more binary output.
So far as I've been able to gather, nobody has figured out the binary output of the /history endpoints yet. But in any case, the most important one here is /instantaneousdemand, which returns nothing more than a fixed-point string and the suffix "kW". Here's mine, with the AC firing on all cylinders:
$ curl -sSL http://192.168.0.199/instantaneousdemand
000004.313 kW
Careful experiments (read: wild-ass guestimation) have revealed that there is about a 3-second delay between the time that some power-hungry device is turned on and the time that the energy bridge changes its reading. Additionally, it does not appear to update the reading more often than about every 3 seconds. So we have about a 3-second granularity at best. Not quite real-time but good enough for government work.
Since this is something we can query, it's something we can store and graph as well. These days you can't even walk down the street without a home automation framework stopping you and telling you that it's sunny outside today but I'm going the more DIY route and will attempt to pipe the energy bridge data into Graphite, a collection of software components for collecting and reporting time-series data.
Disclaimer: "Graphite" is actually an interconnected legion of daemons, programs, and libraries. One of these (the web interface) is also called "Graphite." This poses a bit of an ambiguity problem, as you might imagine. I don't know about you, but I don't have time for all of that, so I am only going to use "Graphite" to refer to the system as a whole and am deliberately choosing to ignore the names of the subsystems and libraries for the remainder of the article for your sanity. You're welcome.
Graphite is most certainly overkill for graphing a single metric but my motives are decidedly ulterior in that I wanted to tinker with graphite a bit anyway. If real home monitoring is your aim, you would be better off taking the rest of the information here and just piping it into your home automation doodad of choice.
Graphite is actually not a trivial thing to set up for a proper production-quality deployment. But today I'm going to cheat and use Docker as the least frictional way to get something useful going. If you're following along with me, you'll need to install Docker first. Before we can fire up Graphite, we need a smidge of configuration first. The default retention for metrics is this:
retentions = 10s:6h,1m:6d,10m:1800d
This says, "Retain one value every ten seconds for the last six hours, and then after that, one value every minute for the last six days, and after that, one value every ten minutes for the last (almost) five years. And then nothing after that." Since we know we can get at least three seconds of resolution out of the bridge, we'd like to bump the retention down to at least that much in order to get as close to real time as we can. Create the following configuration file as storage-schemas.conf and we'll pass it into the container at start up. Since this is a demo, we're just going to throw away all data past 24 hours.
# Carbon's internal metrics. This entry should match what is specified in
# CARBON_METRIC_PREFIX and CARBON_METRIC_INTERVAL settings
[carbon]
pattern = ^carbon\.
retentions = 10s:6h,1m:90d

[default_retention]
pattern = .*
retentions = 3s:24h
Then we just spin up the container with the ports we care about:
docker run \
    -p 80:80 \
    -p 2003:2003 \
    -v $PWD/storage-schemas.conf:/opt/graphite/conf/storage-schemas.conf \
    graphiteapp/graphite-statsd
If you're not aware, the -v argument mounts a local file (or directory) on the host system inside the filesystem of the container. The -p argument to docker maps your host system ports to the container ports. So this is just telling docker to hook up port 80 on localhost to port 80 inside the container. Port 80 is HTTP web interface to Graphite and port 2003 is where we'll be sending our data. If you take a moment to open up your web browser to http://localhost/, you should see this:
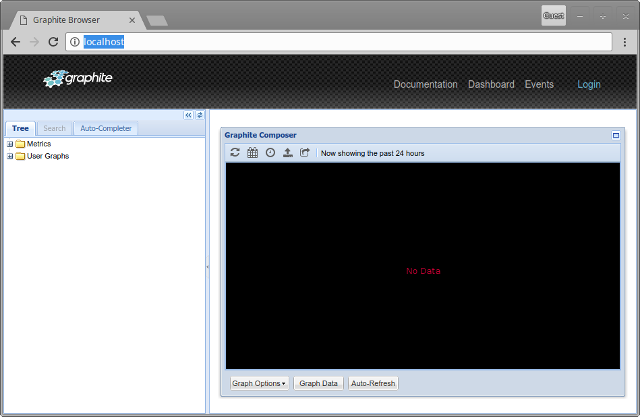
It's always disheartening to not have any data, so let's enhearten ourselves up a little bit. One way that we can get data into Graphite is to just blast it into a TCP socket on port 2003 in the following format:
<metric_name> <metric_value> <timestamp>\n
The metric_name is how we refer to the metric. When you have lots of metrics, you typically organize them into a hierarchy (a tree), much like files on a filesystem. This keeps them both organized and descriptive. One such metric might be cluster.production.node42.cpu.load.5_min or so. For graphing the power usage of our house, we'd be happy enough with something simple like house.power.current_usage.
The metric_value sounds like what it is. The value of the thing we're going to store and graph.
The timestamp is a simply the time associated with the metric. If you're stuffing data into Graphite as you receive it, as we are, this will be the current time. We send it as an integer representing the number of seconds elapsed since [the epoch].
We can spoon feed these into Graphite one at a time with nothing more than a simple netcat command:
echo "house.power.current_usage $current_value $(date +%s)" | nc -q0 localhost 2003
So now we know:
- how to get the current power usage from the energy bridge,
- how to set up a quick-and-dirty graphite instance, and
- how to get the data into Graphite.
Like everything I do in my life, there are better ways to go about this but for the sake of simplicity and illustration , we're going to whip up a little shell script to take care of that last bit. If you know what you are doing with Python, Ruby, Delphi, or what have you, then you are encouraged to do it.
#!/usr/bin/env bash

# grab energy usage info from the energy bridge
# and send it to graphite.

readonly bridge_url=http://192.168.0.199/instantaneousdemand
readonly graphite_metric=house.power.current_usage
readonly graphite_host=localhost
readonly graphite_port=2003
readonly interval=2 # seconds

while :; do
    current_value=$(curl -sSL $bridge_url | cut -f1 -d' ')
        echo "$graphite_metric $current_value $(date +%s)" | \
            nc -q0 $graphite_host $graphite_port
    sleep $interval
done
This is basically automating the two things we already showed above--getting the data from the bridge and pushing it into Carbon. We have an infinite loop that fetches data from the bridge and pushes it to Graphite, with a sleep to keep it from also turning into a CPU busy loop.
You'll notice that $interval is 2 seconds, not 3. Err... whatnow? Well, Graphite's time-series database expects a data point at least every 3 seconds based on the configuration that we gave it above. If the script doesn't keep up with that, we end up with null values in the dasebase which aren't a huge problem but can make the graph look weird. Remember also that we're hitting the bridge on every loop through the script and we don't have much control over how long it takes for that thing to respond. So that extra second acts as a buffer against various delays in the delivery of the metrics.
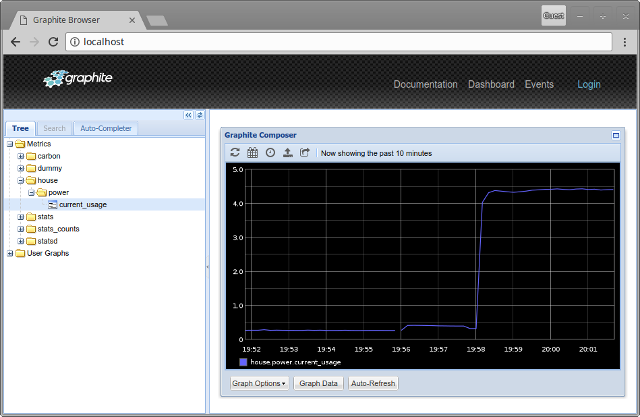
Now if we let that run for a few minutes, we can then go back to our browser window and reload graphite. There's a new folder underneath the "Metrics" tree called "house". Expand that, and then "power, and then we're finally at our metric called "current_usage." If we click on that, we are rewarded for all of our efforts with... a thin blue line!
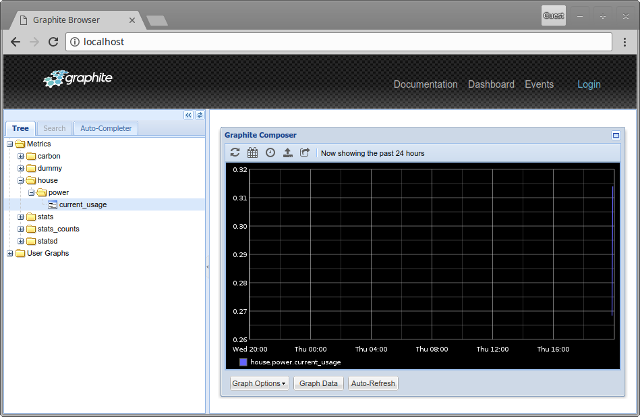
By default Graphite is showing us a graph of the last 24 hours, when we've only been jamming stats into it for a few minutes. In order to see anything interesting, we have to manually select our time period by clicking on the clock icon and selecting a more appropriate time range. Let's say 15 minutes. With that done, we have a much cooler graph. It's quite obvious when exactly my AC kicked on:
There are a whole bunch of ways we can customize this graph, just start clicking around to see some of them. Additionally, Graphite has an API that allows you to fetch any graph in a variety of formats and embed it elsewhere. A widget on your phone. A daily email to yourself. Or you could even display it on a digital dashboard in your kitchen to remind your family how much money is being wasted when lights and appliances are absent-mindedly left on, to pick a totally random and completely fictional example, I assure you, if you are reading this, dear.
Of course if you wanted to make this a permanent installation, there's still lots to do to make it easier to deploy, resilient in the face of failure, and so on. But those parts are boring and are therefore best left as an exercise to the reader.
-
The app also tried to gamify your energy usage experience by offering achievements, points, levels, goals, and more. It was obnoxious to the point of making the core functionality of the app (tracking energy usage) basically unusable. At one point, the app would crash while trying to display some 143 or so "achievements" that I had obtained while taking literally no deliberate action. And there was no way to opt out of it. Blessedly, it looks like that whole thing was scrapped as of the current version of the app. ↩
-
We've all heard the factoid that running a dishwasher uses less water than washing dishes by hand, which is technically true. Missing from this is the fact that dishwashers also use a crap-ton of electricity to heat up the water which actually makes them soulless tree-eating automatons.
↩